According to data from the EIA (U.S. Energy Information Administration), BP (British Petroleum) and other government and corporate sources, even with
all of the plans and incentives in place, by 2050 70% of the total world energy requirement will still be supplied by fossil fuels
Additionally, with the increase in energy demand over the next 30 years, we will in fact be consuming more fossils fuels in 30 years than
we do now...
Currently 84.3% of worldwide energy consumption comes from fossil fuels (figures as of 2019)
True clean energy sources (excl. biomass) supply less than 10% of worldwide energy consumption (as of 2019)
Reliance on fossil fuels has more than tripled over the past 53 years
Reliance on fossil fuels is set to increase by another 25% over the next 30 years, even with clean and renewable energy expansion
Clean & renewable energy supply are also set to increase over the next 30 years,
but not at a fast enough rate to keep up with the year on year energy demand increase
The worlds current plan for an energy transition to truly clean energy, or even just to sustainable renewable sources, is dire
Indepth Study
Current State of our Energy Transition
Despite what big energy companies, news articles and many governments might lead you to believe, as of 2019 84.3% of all worldwide energy
consumption was still derived from fossil fuel sources while less than 10% was derived from truly clean energy sources. According to the BP Statistical Review of World Energy 2020.
A combination of clean and renewable sources made up 11.44% of world energy consumption which is a good start but it has taken decades to
reach just this small percentage.
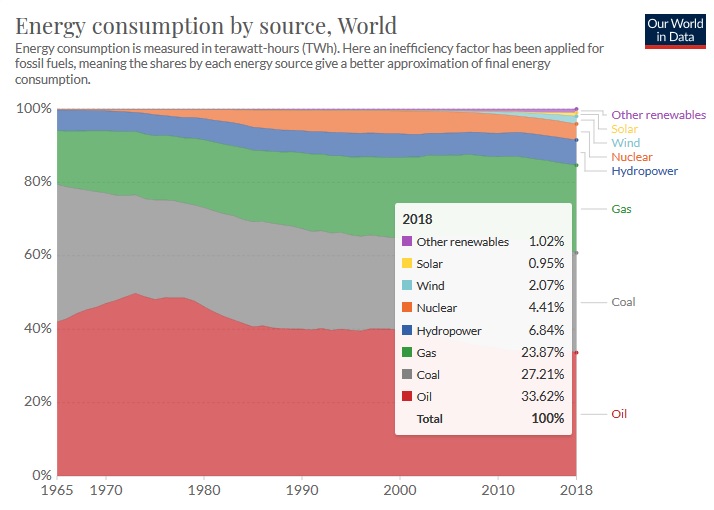
In the first graph below we can see that between 1965 and 2018, the worldwide percentage of energy consumption from fossil fuel sources decreased from 90% to 85%. At first glance this
might seem like progress in the right direction.
However, as we can see in the second graph on the right, during that same time period (1965-2018), global energy consumption has more than tripled.
In the end, this means that although we have reduced fossil fuels as a percentage of our global energy consumption, the overall volume has increased
immensely. In fact, since 1965, we are now using over three times as much fossil fuel
(The exact amount is 3.37 times higher!)
2. Our World in Data: BP Statistical Review of World Energy (2019): Our World in Data[2]
3. Our World in Data: BP Statistical Review of World Energy (2019). Our World in Data[3]
Future Projections
According the U.S. Energy Information Administration, if current trends continue, global energy consumption from fossil fuel sources should drop
from the current 85% to about 70%. This 15% is expected to be replaced by various clean energy sources such as wind and solar.
U.S. Energy Information Administration: International Energy Outlook 2019: EIA Government Report[4]
Although this may also seem like a step in the right direction, this information is again misleading. While there might in fact be a 15%
reduction of fossil fuels as a percentage of overall consumption by 2050, total energy consumption will continue to rise over the next 30 years. As
you can see from our scale corrected chart below, this will actually mean that overall fossil fuel consumption will increase by about 25% by 2050.
When analysing information depicting progression to a cleaner future, it’s vital to pair this information with data of our total amount of energy consumption
to have an accurate understanding of our current state. In summary, we are projected to be consuming far more fossil fuels over the next 30 years
than we do now.
Atlantis CE Adjusted Chart: Data from U.S. Energy Information Administration: International Energy Outlook 2019: EIA Government Report[5]


 +34 910 180 818